(Updated: Feb, 18, 2022)
(Updated for VS 2022: Apr, 20, 2023)
(Updated how to call Win32 API to display a Window Message Box: Sep, 17, 2023)
The Microsoft Visual Studio come with the built-in Macro Assembler and provide many debugging capabilities (Register & Memory View, Breakpoints and Step over). However there is no explicit assembly project template to choose from. In this article, I will describe the steps required to set up an assembly project on the Visual Studio 2019 & 2022.
I had compiled the knowledge from many sources and do many trial and error.
The Sample Projects (for quick reference)
The sample projects of MASM (both 64-bit Assembly and 32-bit Assembly) can be downloaded from the Github links below:
https://github.com/nthana/SampleASM64/
https://github.com/nthana/SampleASM32/
In these samples, I also demonstrate how to call the Win32 “MessageBox” API from the Assembly codes.
1. Installing Visual Studio 2019
Visual Studio 2019 could be downloaded from the site: https://visualstudio.microsoft.com/vs/
The Community 2019 edition is free of charge.

When prompting to select an installed language, I choose C++. I’m not sure whether selecting other languages would work or not for assembly project.
2. Creating a C++ project as a base project
Create a C++ empty project.


Named the project: “MASM”. So that, in the later step, we can save this project as a project template for further use. Set the save location to any preferred folder (I have precreated the folder C:\VSProj). Select “Place solution and project in the same directory” to prevent two nested folders with the same name.
The Visual Studio will create the folder with the same project name automatically.

3. Setup the Build Customization as Assembly Language
Right click at the project name > Build Dependencies > Build Customizations…

Select the “masm”, then OK.
(It should not already been selected. If it is, you should restart Visual Studio and retry again.)

Right click at the project name > properties > Linker > System > SubSystem : Windows
This will prevent the assembly program to show the console window ( the black text-mode window). Or if you want the console window you can leave it at the default: Console mode.
I prefer the Windows mode because it has look-and-feel of native windows app. For debugging, just use breakpoint and watch windows to look at register and memory values at real-time. However, if we want to test the text mode input/output, we should use the console mode.

4. Creating an Assembly Source File
Right click at the project name > Add > New Item…

Name the file: “Main.asm” . The selected item type is not important. Any type can be selected. But it is important to name it with the “.asm” file extension.

Write a test program. You can copy the code from below. I adapted the code from the wonderful book : Assembly Language for x86 Processors by Kip Irvine. I highly recommend this book for anyone start learning the Assembly language.
Firstly, We will create the 32-bit Assembly Code. And then at the appendix B, we will create the 64-bit Assembly Code.
The 32-bit Assembly Code :
.386
.model flat, stdcall
.stack 4096

ExitProcess PROTO, dwExitCode:DWORD

.data
myList DWORD 2, 3, 5, 8

.code
main PROC
  mov eax, 7
  add eax, 8
  INVOKE ExitProcess, eax
main ENDP

END main        ;specify the program's entry point
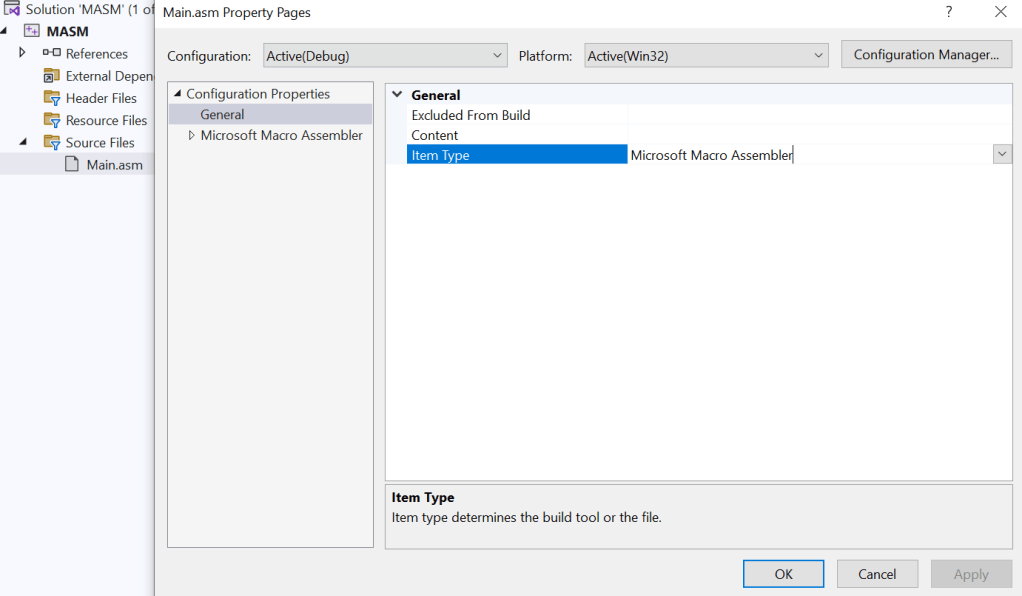
For Visual Studio 2022, we need to select our source code item type : Microsoft Macro Assembler.
To build the 32-bit Assembly, make sure that “x86” is selected in the “solution platform” drop down of the toolbar.


Press the green, play button: (run with) Local Windows Debugger.
The program will sum 7 with 8 and return the result 15 as shown in the debug output window.
5. (Optional) Setup Listing File
The listing file is useful for examining what the assembler has generated. To setup the listing file generation, right click the project name > Properties > Microsoft Macro Assembler > Listing File > Assembled Code Listing File : $(IntDir)$(ProjectName).lst
Note: The page “Microsoft Macro Assembler” will appear only when there are some assembly files in the project.

Build (and/or run) the project again. You will see the listing file generated at the project’s debug folder.

Drag the listing file into Visual Studio to view it. The listing file content will be like this:

6. (Optional) Setup for Release Mode Build
This section could be skip because it is quite complex. Do it when you need to use the release mode for release build. Or you could come to this section later when in need.
In Visual Studio, there is a separate release mode build configuration. The release mode configuration could be set differently from the debug mode configuration. For example, the release mode may have more optimizations and less debugging features.
If the release mode is needed, we should do the same as the step 3 and 5. Additionally, we need to customize the safe exception handler configurations.
6.1 Setup Subsystem (Windows or Console) and Listing File Generation
Go to the project properties > change the configuration mode to : Release.

Choosing your prefer subsystem (Windows or Console).

Setting up the listing file generation.

Changing the active configuration to Release.

Try building and running the program using the green play button. You will see the error message: “fatal error: LNK1281: Unable to generate SAFESEH image.”.
The next step 5.2 will solve this error.

6.2 Fully Enable or Disable the Safe Exception Handlers
In the release build mode, the default option of the linker is that every images (object files) should have safe exception handlers. However, the default option of the assembler (compiler) is not to use safe exception handlers. These conflicts cause the above error. Now, we have two choices to fix the error.
Way 1: Enable the safe exception handlers in the assembler (compiler).

Way 2: Or we could entirely disable the use of safe exception handler at the linker.
Linker > Advance > Image has Safe Exception Handlers : No
Choose one way but not both!
I preferred way 1 because it looks safer to have safe exception handlers. But, in fact, I am not 100% sure because I don’t have much knowledge about safe exception handlers.
After that we should be able to build and run the program in the release mode without any error.
Caution on switching between Debug and Release : When changing the active configuration in the toolbar and then open the project property pages, the property pages may not be conformed to the current active configuration. This could cause confusion when changing some project settings appear to not affect the current build. If this occur, please ensure the matching of active configuration and the property pages.
7. Save as a Project Template
After these long steps, we might not want to do them every time to create a new Assembly project. Fortunately, Visual Studio can save the project as a project template.
First, edit the Main.asm to contain only template code:
.386
.model flat, stdcall
.stack 4096

ExitProcess PROTO, dwExitCode:DWORD

.data

.code
main PROC

  INVOKE ExitProcess, 0
main ENDP

END main        ;specify the program's entry point
Try running it to make sure that the program works correctly.
If you still use release mode (from step 5), switch back to the debug mode.

Click: Project > Export Template …

Choose our “MASM” project from the drop down list.

Describe the template description.

Finished!
After that when you create a new project, you could select MASM as a project template.

Appendix A: Debugging
Debugging is straightforward in Visual Studio. To set a breakpoint, just clicking the grey area in front of the line of the source code. When running, the program will pause before the execution of the breakpoint line.
To look at registers, select Debug > Windows > Registers
To look at variables, select Debug > Windows > Watch. Then type the variable name.
Or select Debug > Windows > Memory > Memory 1. Then type “&varname” at the address box.

Also, we can debug step-by-step using “Step Into” and “Step Over”.

Appendix B: Setup the 64-Bit Assembly Project
This section describes additional steps needed to setup a 64-bit assembly project. You should finish the prior steps before doing these steps.
1. Select the 64-bit platform
At the toolbar, set the Solution Platform to “x64”.

2. Creating the 64-bit Assembly Source Code
Copy the code below to replace the old code in main.asm:
The 64-Bit Assembly Code
ExitProcess PROTO

.data

.code
main PROC

	sub rsp, 28h   ;reserved the stack area as parameter passing area
	mov rcx, 12345678   ; specify Exit Code
	call ExitProcess
main ENDP

END
Please note that the 32-bit and 64-bit assembly code are different in many ways.
In 64-bit Assembly Code:
- Some directives, such as “.386”, are not used.
- PROTO doesn’t have parameter list specified.
- END doesn’t have “main” start symbol specified.
- When calling Win32 API such as “ExitProcess”, parameters will be passed on registers (rcx, rdx, r8, r9). (see details in Appendix C)
3. Specifying the “main” start symbol (entry point)
When Build, you may get the error: unresolved external symbol mainCRTStartup.

To fix this error:
- Open the project properties page (see image below) by choosing Project > Properties.
- Then make sure that the “Active(Debug)” Configuration and “x64” Platform are selected.
- Set the Linker > Advance > Entry Point to “main“
If you also want to use the release mode build, do the same for the configuration: “Release”, platform: “x64”.

You can also choose the SubSystem: Console or Windows as you preferred.

Run the program. The return code from calling ExitProcess will be displayed on the output windows correctly.

Appendix C: Microsoft x64 calling convention
Microsoft had defined the way that the 64-bit assembly code should call the Win32 API. This specification is called “Microsoft x64 calling convention”. Some essential points are:
- The first four arguments are passed by registers (rcx, rdx, r8, r9).
- Some stack memory, called the shadow area, must be reserved (at least 4*8 bytes)
- 16-byte stack pointer alignment (rsp = stack pointer register) is needed before calling any win32 API.
That are the reasons of this line in the 64-bit assembly code:
sub rsp, 28h ;reserved shadow areaWe need to reserve at least 32 bytes (20h) as the shadow area. And main proc always start at the address ending 8h. So, to do 16-byte alignment, we need to add another (8h) bytes. That’s why we subtract rsp by (28h) bytes. (the stack grows down)
Displaying A Message Box
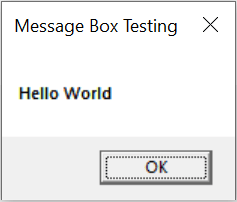
Consider the following code. This code calls the MessageBox Win32 API.
ExitProcess PROTO
MessageBoxA PROTO

.data
myText			db "Hello World", 0
myCaption		db "Message Box Testing", 0

.code
main PROC
	sub rsp, 28h		; reserved shadow area

	mov rcx, 0
	lea rdx, myText
	lea r8, myCaption
	mov r9, 0
	call MessageBoxA

	mov rcx, 12345678	; the exit code
	call ExitProcess

END
I have tried to depict the call stack memory layout in the following diagram. Notice that rsp-28h will align the stack pointer into 16-byte alignment beautifully, because the main() procedure is always start with the stack pointer having address ending with 8h. You can see this fact yourself by debugging the above code, running it step by step and observing register values in the register window.

To verify that the alignment requirement is needed, try changing the “sub rsp, 28h” into “sub rsp, 20h“. This will cause the Access Violation run-time error, when calling MessageBox():

Some Win32 APIs are not that strict. For example, the ExitProcess don’t cause the Access Violation Exception. But to respect the x64 calling convention, every 64-bit assembly code that call Win32 API should have some statement like “sub rsp, 28h” to reserve shadow area and adjust stack pointer alignment.
Please note that if use full x64 prolog/epilog code, the “sub rsp, 28h” must be changed to “sub rsp, 20h” because the prior “push” instruction has changed the rsp by 8h bytes. So, need to subtract only 20h.
Normal x64 Prolog/Epilog Code
.code
main PROC
                   ; usual x86-64 Prolog code
    push rbp       ;   save caller's rbp
    mov rbp, rsp   ;   use rbp as a frame pointer
    sub rsp, 20h   ;   reserved as Win32 parameters' shadow area

                   ; Do Something

                   ; usual x86-64 Epilog code
    mov rsp, rbp   ;   restore stack pointer
    pop rbp        ;   restore caller's rbp
    ret
main ENDP

 Programming Haven
I am trying to use asm using Vstudio 2019, but it not compile the asm source
LikeLike
What is the error detail you get?
LikeLike
Awesome, thanks for that. Just what I wanted to know.
LikeLike
You’re welcome! 🙂
LikeLike
That was extremely helpful and well written.
LikeLike
Thank you for the comment and you’re welcome. 🙂
LikeLike
thak u for ur effort,
LikeLike
My pleasure. 🙂
LikeLike
Hi,
Great tutorial, just one thing. I’m unable to get an output console, only get a code saying ‘The program ‘[17252] TEST.exe’ has exited with code 0 (0x0).’
Any suggestions?
LikeLike
You’re welcome.
Step 3: set SubSystem to “Console” instead of “Windows”.
LikeLike
Works great!
I had a problem trying to use 64 bit registers (rax) , and could only use 32 bit registers.
Any idea how to change the project to support 64 bit registers?
LikeLike
Please check your Windows version. Is it the 64-bit version?
LikeLike
1. At the tool bar > change the drop down list from “x86” to “x64”
2. Set: configuration > linker > advance > entrypoint : “main”
3. Try this 64 bit assembly code:
ExitProcess PROTO
.code
main PROC
sub rsp, 28h
mov rcx, 1234
call ExitProcess
main ENDP
END ; for 64 bit, need to specify the program’s entry point
; at configuration > linker > advance > entrypoint : “main”
LikeLike
U can use:
public mainCRTStartup
mainCRTStartup:
sub rsp, 28h
xor rcx, rcx
call ExitProcess
nop
END
LikeLike
Thank you for this. One problem I had was:
LNK 2001 unresolved external symbol _mainCRTStartup
and the solution at https://stackoverflow.com/questions/12379794/lnk-2001-unresolved-external-symbol-maincrtstartup-masm
LikeLiked by 1 person
U can use:
public mainCRTStartup
mainCRTStartup:
sub rsp, 28h
xor rcx, rcx
call ExitProcess
nop
END
(is the same way)
LikeLike
Excellent and effective presentation. Nice job !
Do you know how to convert 8086 assembly code to 32 bit ?
LikeLike
Thank you! I’m not sure how to convert from 8086 to 32 bit.
Do you also want to change the underlying OS from DOS to Windows?
1. I think that assembly commands for 8086 could be directly used on 32-bit. (Backward compatibility from Intel)
2. For interrupt handling, some interrupt command may need to be replaced by Win32 API call.
However, I don’t have direct experience on the conversion.
LikeLike
Thank you very much !!!
LikeLike
Wow very nice. Thank you.
But please how do i view the CPU status flags?
LikeLike
You could right click the register pane, then select the “Flag” option at the pop-up menu.
LikeLike
I followed the exact same steps as explained here, but the assembler fails with exit code 1:
Error MSB3721 The command “ml.exe /c /nologo /Zi /Fo”Debug\Main.obj” /Fl”Debug\MASM.lst” /W3 /errorReport:prompt /TaMain.asm” exited with code 1.
If I then copy the exact command line in the Developer command prompt, it works fine. Then I copy the link command line and the build completes succesfully:
C>ml.exe /c /nologo /Zi /Fo”Debug\Main.obj” /Fl”Debug\MASM.lst” /W3 /errorReport:prompt /TaMain
.asm
Assembling: Main.asm
C>link /OUT:”C:\Users\XXXXXXXX\Documents\Visual Studio 2019\Projects\MASM\Debug\MASM.exe” /MANIFE
ST /NXCOMPAT /PDB:”C:\Users\XXXXXXXX\Documents\Visual Studio 2019\Projects\MASM\Debug\MASM.pdb” /
DYNAMICBASE “kernel32.lib” “user32.lib” “gdi32.lib” “winspool.lib” “comdlg32.lib” “advapi32.lib”
“shell32.lib” “ole32.lib” “oleaut32.lib” “uuid.lib” “odbc32.lib” “odbccp32.lib” /DEBUG /MACHINE
:X86 /INCREMENTAL /SUBSYSTEM:WINDOWS /MANIFESTUAC:”level=’asInvoker’ uiAccess=’false'” /Manifest
File:”Debug\MASM.exe.intermediate.manifest” /LTCGOUT:”Debug\MASM.iobj” /ERRORREPORT:PROMPT /NOLO
GO /TLBID:1 debug\main.obj
C>dir /b Debug
Main.obj
MASM.Build.CppClean.log
MASM.exe
MASM.exe.intermediate.manifest
MASM.ilk
MASM.log
MASM.lst
MASM.pdb
MASM.tlog
MASM.vcxproj.FileListAbsolute.txt
If I then start the Visual Studio debugger (F11) I receive the message:
“Source information is missing from the debug information for this module”
and I cannot use symbolic debugging.
LikeLike
I’m not sure about the error. Could you zip the test project and send me the link?
Or send to me at the facebook page:
https://www.facebook.com/programming.haven
LikeLike
I spent 2 days, but now I know what is going on. The project is fine. No problem there. It assembles, links and runs correctly outside of Visual Studio. The problem here is Visual Studio. It says that ML.EXE returns errorlevel 1, but that is not true. ML.EXE returns 0. In fact, Visual Studio never creates a process for ML.EXE and can therefore not know what the errorlevel is. What happens is that Visual Studio creates a batch file (.cmd) in the user’s temp folder and executes that batch file from there. If that batch file fails, then Visual Studio assumes that ML.EXE generated the error. Not necessarily true also, since LINK.EXE could have failed instead of ML.EXE.
Now, why does that batch file fail on my computer but not on yours? For obvious security reasons, I use on my computer a group policy that prohibits code execution from the user’s temp folder (and in fact, any writeable folder). As a result the Visual Studio build process fails, of course.
I believe that it is not a good security practise what Visual Studio is doing. Granted, some writeable folder is needed for the build with permission to execute. But to use the user’s temp folder is too obvious. I normally grant an exception for the project folder until the project is finished or not needed anymore.
What the good solution is here, I do not know yet. I do not know if the temporary file location in Visual Studio can be changed. If yes, the project folder should be used. Any idea if that is possible?
LikeLike
Wow, very informative. Thank you for sharing this.
I have no experience changing the visual studio temp folder, though. Please feel free to share your progress. Very interesting case.
LikeLike
You should add a note that you must change the project to 32 bit. If you leave it at the default 64 bit, you get errors for lines such as:
.386
.model flat, stdcall
.stack 4096
The compiler doesn’t tell you that it’s a simple matter of switching down to 32 bit, so it can be time consuming to troubleshoot for someone who is not already skilled in assembly.
LikeLike
Thank you for your advice. I am currently updating as your advice. Also, I have added the sample MASM projects for both 64 bit and 32 bit versions on the github.
LikeLike
Hi, thank you for this tutorial, pretty neat, i’m using VS 2022 and i don’t have this panel: “To look at registers, select Debug > Windows > Registers”
LikeLike
I have just tried the VS 2022. Please refer to this document: https://docs.microsoft.com/en-us/visualstudio/debugger/how-to-use-the-registers-window?view=vs-2022
The menu “Debug > Windows > Registers” will be appeared only when:
1. In the debug mode. (try adding a breakpoint (F9) and then run (F5) the program)
2. Make sure that this option is enabled: “Enable address-level debugging” in Tools (or Debug) > Options > Debugging. (refer to above doc.)
LikeLike
Adding a break point made the trick, thank you.
LikeLike
Hello, i’ve setup this tutorial for compiling assembler with VS and nasm:
https://manul156.blogspot.com/2022/06/how-to-setup-nasm-netwide-assembler-on.html
There is also very good and friendly videos from Creel on youtube to learn MASM and VS:
regards.
LikeLike
this is really helpful
LikeLike
Awesome! Very clear explanation, it’s been 30+ years since I last did assembler in Borland Turbo Pascal on an x86 so memories are coming back 🙂
LikeLike
In your x64 version, simply close your main procedure as follows:
main ENDP
Your x64 version will then successfully run and produce the intended Message Box.
LikeLike
Thank you. I will try it.
LikeLike